GoFlow
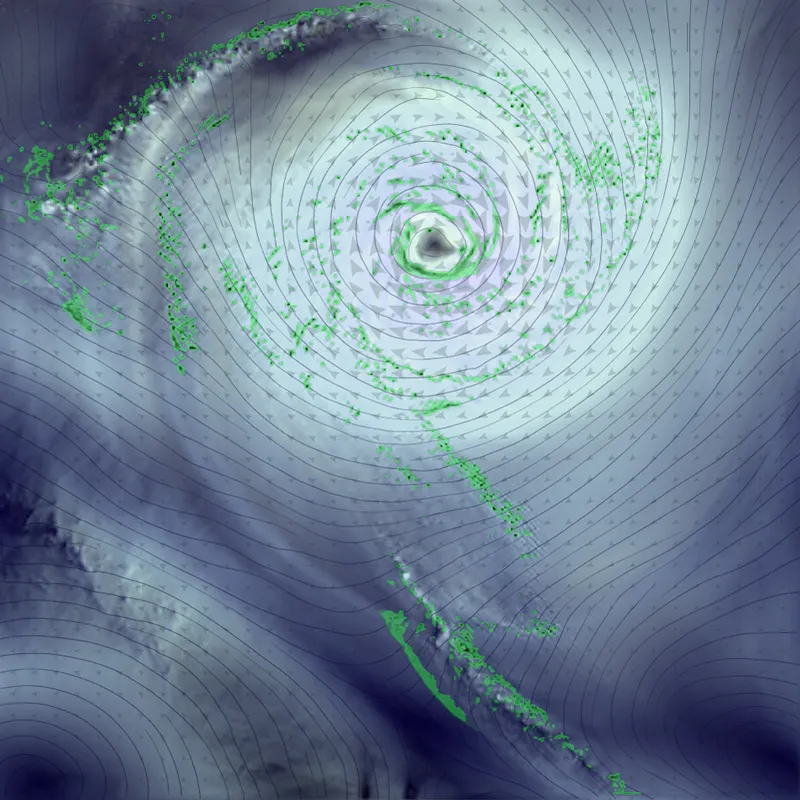
A Mac OS X program for visualising two-dimensional stream data, using arrows, streamlines, and colour-coded measures like temperature.
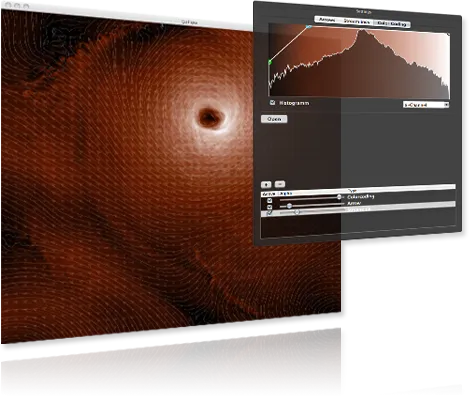
To make 2D stream data legible, the visualisation has to expose direction, flow, and magnitude at a glance: streams read as arrows or continuous lines, while additional measures such as temperature can be colour-coded into the same view. GoFlow combines those techniques into one OpenGL-based viewer, built together with Sebastian Paulmichl for the lecture Visualization at the Vienna University of Technology.
GoFlow combines three core techniques and features:
- Arrow plot
- Streamline visualisation
- Colour coding
All three can be parameterised independently. You can download GoFlow here.