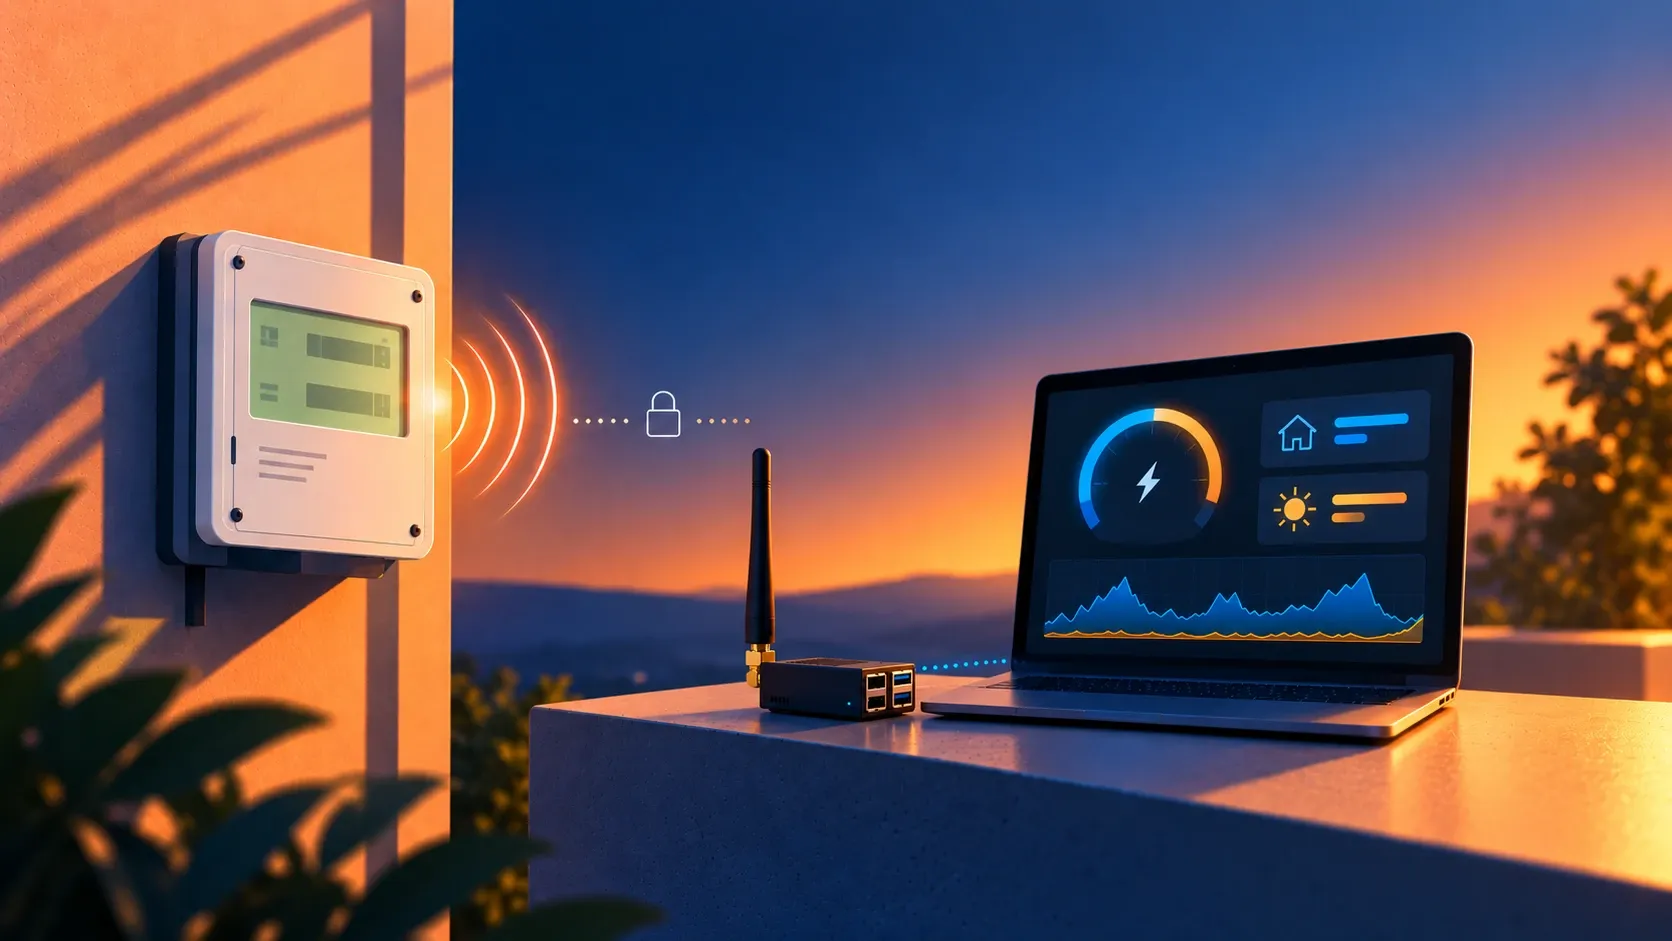
The meter's customer interface (Kundenschnittstelle) uses wireless M-Bus, mode T1 on 868.95 MHz. The telegrams are AES-128 encrypted with a personal key from the LINZ NETZ service portal. The open-source tool wmbusmeters decodes them, and its Home Assistant add-on publishes the values via MQTT. This guide walks through the whole chain. It works even if your meter sits outside your flat, as long as the dongle is in radio range. The stock decoder sometimes reports wrong energy values for these meters, so Step 4 installs a small custom driver before the meter is added.
What you need
| Item | Notes |
|---|---|
| Home Assistant on a Raspberry Pi 4 or 5 | Home Assistant OS, so add-ons are available; tested on a Pi 5 |
| RTL-SDR USB dongle (R820T/R828D tuner) | For example the RTL-SDR Blog V3 or V4 |
| 868 MHz antenna | The dipole from the dongle kit (each arm about 8.2 cm) or a ready-made 868 MHz/LoRa whip |
| USB extension cable, 1 to 2 m | Optional. Keeps the dongle clear of USB 3 noise and lets you move it to a better spot |
| LINZ NETZ service portal account | To activate the interface and fetch the key |
The Pi must be within radio range of the meter cabinet. A meter in the building's meter cabinet, outside the flat, is typically received reliably on auto gain.
Step 1: Activate the customer interface and get the key
The meter only transmits on its customer interface once you activate it.
- Log in to the LINZ NETZ service portal and open Online-Services, then Serviceportal, then Meine Kundenschnittstelle, then Kundenschnittstelle aktivieren.
- Select your installation (Basisanlage) and activate it.
- Wait. LINZ NETZ provisions the meter remotely and provides the access code (Zugangscode) within a few days.
- Open the same page again and click through: the code is shown there for 14 days only. Store it right away, for example in a password manager.
The code is the AES key: 32 hex characters, without spaces. Treat it like a password and keep it out of screenshots, forums and Git repositories.
Step 2: Check reception on a laptop (optional)
Before touching Home Assistant, you can check with the same dongle on a laptop whether the meter is reachable from where the Pi will stand. On macOS with Homebrew:
brew install rtl_433
# enable all wireless M-Bus decoders and listen on 868.95 MHz
rtl_433 -f 868.95M -s 1200k -F json \
$(rtl_433 -R help 2>&1 | grep -i m-bus | grep -oE '\[[0-9]+\]' | tr -d '[]' | sed 's/^/-R /')Your meter shows up as "M" : "DEV" with "type" : 2 (electricity), every five seconds, with an encrypted payload. Other wireless M-Bus devices in the building (heat and water meters) will appear too; ignore them. A PLL not locked warning at start is harmless.
To test decryption offline, take one telegram as hex and run it through wmbusmeters (on macOS it builds from source, see its README):
wmbusmeters --analyze=<KEY> <TELEGRAM_HEX>It should report decrypt check bytes (OK) and pick the driver amiplus. No telegrams at all right after activation? The meter stays silent until LINZ NETZ has finished provisioning, which can take a few days.
To skip the manual steps, the helper script wmbus-test.sh in the smartmeter folder of ulrichlehner/homebase wraps all of this for macOS: setup installs and builds the tools locally, scan searches for the meter across frequencies and gain settings, and analyze decrypts the last telegram with your key.
Step 3: Install Mosquitto and the wmbusmeters add-on
- Plug the dongle into a USB 2.0 port of the Pi (on a Pi 5 the black ones, not the blue USB 3.0 ports, whose noise can disturb the radio) and place the antenna upright, as high as practical and away from metal. A USB extension helps if the Pi sits in a bad spot for reception.
- Settings, Add-ons, Add-on Store: install and start Mosquitto broker. Home Assistant then offers the MQTT integration; add it.
- In the Add-on Store, open the menu (⋮), then Repositories, and add
https://github.com/wmbusmeters/wmbusmeters-ha-addon. - Install and start the wmbusmeters add-on. Without a meter configured it only listens.
The add-on ships rtl_sdr and rtl_wmbus, so nothing else is needed on the Pi. The setup lives in the add-on's own web interface (Open Web UI); the Configuration tab only has reset_config.
Step 4: Install the custom driver
The stock amiplus driver misreads the energy counters of these meters from time to time (details in Why a custom driver). The custom driver amiplus_linznetz fixes that, so install it before adding the meter. It consists of two files from the smartmeter folder of ulrichlehner/homebase: drivers/amiplus_linznetz.xmq and ha/mqtt_discovery/amiplus_linznetz.json.
These steps are for add-on version 3.0.0-RC1 on Home Assistant OS. Do them in this order.
- In the add-on's web interface, on the Home tab, set
wmbusmeters config locationto/homeassistant/wmbusmetersand save. This add-on version mounts the Home Assistant configuration as/homeassistant. A location under/configis a throwaway folder inside the add-on's own container (every Home Assistant add-on runs in one), and files you put there are lost when the add-on is updated. Afterwards the folder shows up on the host as/config/wmbusmeters. - Copy
ha/mqtt_discovery/amiplus_linznetz.jsonto/config/wmbusmeters/etc/mqtt_discovery/(File editor or Terminal & SSH add-on). The add-on only creates that folder once MQTT discovery is enabled and it has started, so create it yourself if it is missing (mkdir -p /config/wmbusmeters/etc/mqtt_discoveryin the Terminal add-on). The add-on does not overwrite files you put there. It builds the Home Assistant entities from a filemqtt_discovery/<driver>.json; for an unknown driver it logsFile ... not foundand removes all sensors of the meter. - In the web interface, open the Drivers tab and add a driver named
amiplus_linznetz.xmq. Keep the extension: the add-on saves the name as typed, and wmbusmeters only loads.xmqfiles. Paste the content ofdrivers/amiplus_linznetz.xmq.
Step 5: Configure the meter and verify
In the add-on's web interface, add the meter under Meters, Add New meter:
| Setting | Value |
|---|---|
| name | A short, unique name such as <Place> grid, see below |
| driver | amiplus_linznetz |
| id | Your eight-digit wireless M-Bus ID |
| key | The access code from the service portal |
Don't know the meter ID yet? The add-on from Step 3 is running without a meter, so its log lists every telegram it ignores, and yours is the one with manufacturer DEV. That ID is not the meter number or the metering point number from the portal, so copy it from the log.
Under MQTT, check Enable mqtt discovery. Leave the other parameters (device, format, loglevel, shell and so on) at their defaults and click Save Changes.
As plain wmbusmeters meter configuration the same settings read:
name=<Place> grid
driver=amiplus_linznetz
id=<METER_ID>
key=<KEY>
The meter's name is more than a label. It becomes the MQTT topic (wmbusmeters/<name>), the device name in Home Assistant and the prefix of all its entity names. A readable name works: Home Assistant shows <Place> grid total energy consumption and turns it into the entity ID sensor.<place>_grid_total_energy_consumption. Keep it unique per meter: two meters with the same name publish to the same topic and overwrite each other. A good pattern is <Place> <Role>, where the place is, for example, the municipality and the role says what the device is: <Place> grid for the grid meter, later perhaps <Place> PV for a solar inverter. Renaming afterwards means deleting the device and its statistics, so decide before the first start.
Restart the add-on and check the log: seven Add/update topic lines, no No such driver, and Started auto rtlwmbus ... listening on t1 at the end. The log prints the key, the ID and the meter name in clear text on every start, so never paste it into a forum or a repository without blanking those lines.
To see the raw JSON, open Settings, Devices & services, MQTT, Configure, and listen to wmbusmeters/#:
{
  "meter": "amiplus_linznetz",
  "media": "electricity",
  "current_power_consumption_kw": 0.09,
  "current_power_production_kw": 0,
  "total_energy_consumption_kwh": 123.456,
  "total_energy_production_kwh": 16.5,
  "rssi_dbm": 20
}
With discovery enabled, a device with sensors for current power and total energy (import and export) appears automatically. The total energy sensors already carry device_class: energy and state_class: total_increasing.
Step 6: Add the meter to the Energy dashboard
The energy bars and totals of the Energy dashboard are built from the long-term statistics of your sensors, not from their live state. Only the optional live power display (item 6 of the list below) reads the current state. That is why only sensors with the right metadata (device_class: energy, state_class: total_increasing, unit kWh) can be picked, and why the first bars take a while. The sensors from the discovery have it.
- Open Settings, Dashboards, Energy. The page has tabs for electricity, gas and water. Stay on the electricity tab.
- In the section Electricity grid, click Add grid connection.
- Under Grid consumption, pick the total energy consumption sensor of your meter, for example
sensor.<place>_grid_total_energy_consumption. - Leave Return to grid empty if you do not feed in. Without solar the export counter of a new meter sits on a fixed starting value and never moves, so it would only add a section that measures nothing. Once you have a PV system, edit the connection and add the total energy production sensor here.
- Choose how to track costs (none, a fixed price per kWh or a price sensor).
- Optional: under Power measurement type you can add live power to the dashboard. Without feed-in choose Standard and pick the current power consumption sensor, because a positive value means import. With a PV system choose Two sensors and pick the current power consumption sensor for import and the current power production sensor for export, and fill in both fields. Without a power sensor the dashboard shows the hourly bars only.
- Save. You can also put the current power sensor on a dashboard card or use it in automations, for example a notification when the base load stays above a threshold overnight.
Expect a delay. Home Assistant says a new device can take up to two hours to show data; in practice the first bar appears after the next full hour. For a few minutes the page may also warn about "Statistics not defined" for the sensor. That is normal for a fresh entity and goes away once the first statistics are written. If the warning still names a sensor you no longer have, open the grid connection, check which sensor is selected, and remove and re-add the connection.
Why a custom driver
With the stock driver the Energy dashboard can show hourly bars of hundreds or thousands of kWh. The meter's telegrams switch between three states:
| State | Import record | Export record | What the stock amiplus driver reports |
|---|---|---|---|
| Matches LN-666 | 0E 03 (Wh) | 0E 83 3C | Correct |
| Wrong exponent | 0E 04 (10 Wh, inferred from a ten-fold phase, not seen in a captured telegram) or 0E 07 (10,000 Wh) | 0E 84 3C or 0E 87 3C | 10 or 10,000 times too high |
| All zero | 0E 00, digits all zero | 0E 80 3C, digits all zero | 0 kWh |
In the wrong-exponent state the digits are right and only the unit exponent is wrong. In the all-zero state both energy counters read zero while the power values stay normal. The states alternate from one telegram to the next and can last many minutes. wmbusmeters scales by the exponent, as it should, so Home Assistant gets a sensor that jumps ten-fold or 10,000-fold, or drops to 0 and back. A total_increasing sensor counts the drop as a meter reset and the return as consumption of the whole counter, so the dashboard books kWh that never flowed.
The fix is the custom driver amiplus_linznetz from Step 4. It reuses the relevant amiplus fields with these changes:
- The energy digits are read as Wh whatever the exponent says:
vif_scaling = Noneplusforce_scale = 1/1000to get kWh. - A counter value of 0 becomes
null(null_value = 0). A real counter is never 0, and Home Assistant showsunknownfor those telegrams instead of 0. It ignoresunknownin the statistics, so no fake reset happens. - The driver is never picked automatically. Its detection data is a dummy, so the stock
amipluskeeps working for other meters, and you selectamiplus_linznetzby name in the meter settings (Step 5).
field {
    name              = total_energy_consumption
    quantity          = Energy
    vif_scaling       = None
    force_scale       = 1/1000
    null_value        = 0
    dif_signedness    = Signed
    match {
        measurement_type = Instantaneous
        vif_range        = AnyEnergyVIF
    }
}
The export field is the same with add_combinable = BackwardFlow. The repository also holds synthetic, unencrypted test telegrams and a script that runs them through the stock and the custom driver, so you can see the difference without a meter.
Things that look wrong but aren't
- Export counter above zero without solar. A new meter can leave the factory with a few kWh on both registers from calibration testing. One meter showed about 16.5 kWh export that never moves. The Energy dashboard only counts increases, so it doesn't matter. Only worry if it starts climbing.
- Import counter higher than your consumption since installation. Same reason: roughly 20 kWh of test energy before the meter reached the flat.
rssi_dbmof +20 dBm. With an RTL-SDR this is an uncalibrated relative level, not real dBm. Higher is better, but it jumps with auto gain. The reliable signal is the update rate: one telegram every five seconds means reception is fine.- Sensor "voltage at phase 1" stays unknown. The
amiplusdriver knows this field from other meters, but LINZ NETZ telegrams don't carry it. Disable the entity, or use the custom driver from Step 4, which leaves these fields out. - The energy sensors show
unknownfor minutes or hours. That is the all-zero state described in Why a custom driver. The custom driver turns the zeros intounknownon purpose, and the power sensors keep updating. When real values return, the counter continues where it was.
Sources
- LINZ NETZ: Beschreibung Wireless M-Bus Schnittstelle (LN-666): mode T1, 868.95 MHz, 5 s interval, AES-128 encryption, telegram layout and a test vector
- wmbusmeters: decoder, driver
amiplus - wmbusmeters Home Assistant add-on
- rtl_433
- Helper script for reception and decryption tests: ulrichlehner/homebase, in the
smartmeterfolder